Load testing with Locust

I wanted to perform some user load testing on the HTTP endpoint of our internal metrics collection system. After a bit of googling I decided to use Locust.
I chose to use Locust over tools such as JMeter and The Grinder because:
- You write the tests in code (Python) - no XML or user interfaces from the ’90s.
- It’s extendible. Out of the box it tests HTTP endpoints, but it can be extended to test anything. While I don’t need this feature at the moment, I can see myself wanted to load test other endpoints, such as RPC calls, in the future. It’s great that I can learn just the one load testing tool.
Getting Started
Once installed, the first thing you need to do is write your test case, which is just a few lines of simple Python. Mine looks like this.
from locust import HttpLocust, TaskSet, task

json = """
[{
  timestamp: 1339594030236,
  type: test_event,
  fields: [
    { foo: 'FOO' },
    { bar: 'BAR' },
  ],
  version: 1
}]
"""

class MyTaskSet(TaskSet):
    @task
    def send(l):
        l.client.post("/", json)

class MyLocust(HttpLocust):
    task_set = MyTaskSet
    min_wait = 5000
    max_wait = 15000
I only have one URL to test, so it’s pretty simple. I make a POST request to this URL with some JSON.
To start Locust, simply run the locust tool, passing in the host you want to test.
locust -H http://localhost:37010
It’s not doing anything at the moment. To start the load testing, you need to open up the web interface at http://127.0.0.1:8089 (if your’re running Locust locally) and choose the amount of users to simulate, and their hatch rate (i.e. how fast the users will spawn).
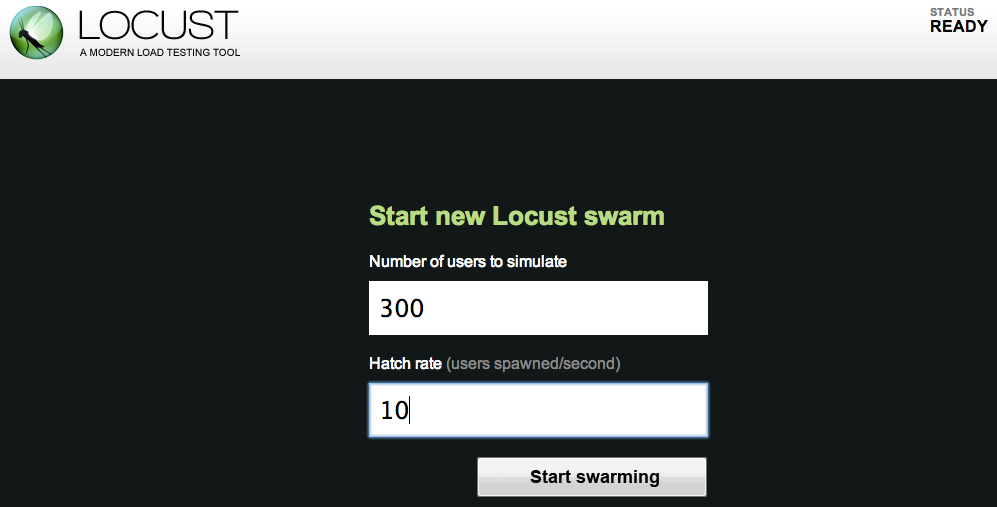
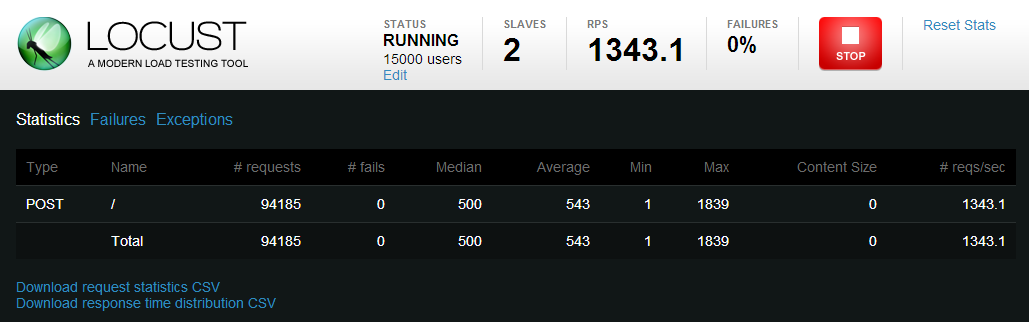
Now Locust will start spawning users to hit your web app. You can see at the top of the screen how many users have been “hatched” so far. Once all the users are hatched, the stats will reset, and it will continue to make requests to your web app using all the users.
And that’s it. Once you’re happy with the amount of requests you have made against your app, you can stop Locust from the web interface. You can then look at any failures or exceptions received, and download your results as CSV files.
Analysing The Results
So you have some data. What does it mean? Well, I’m no load testing expert, but this is how I read them.
For each request (requests.csv), Locust tells you:
- how many requests were made
- the number of failures
- the Median, Average, Min, and Max of the requests (in milliseconds)
- the size of the response
- the requests per second
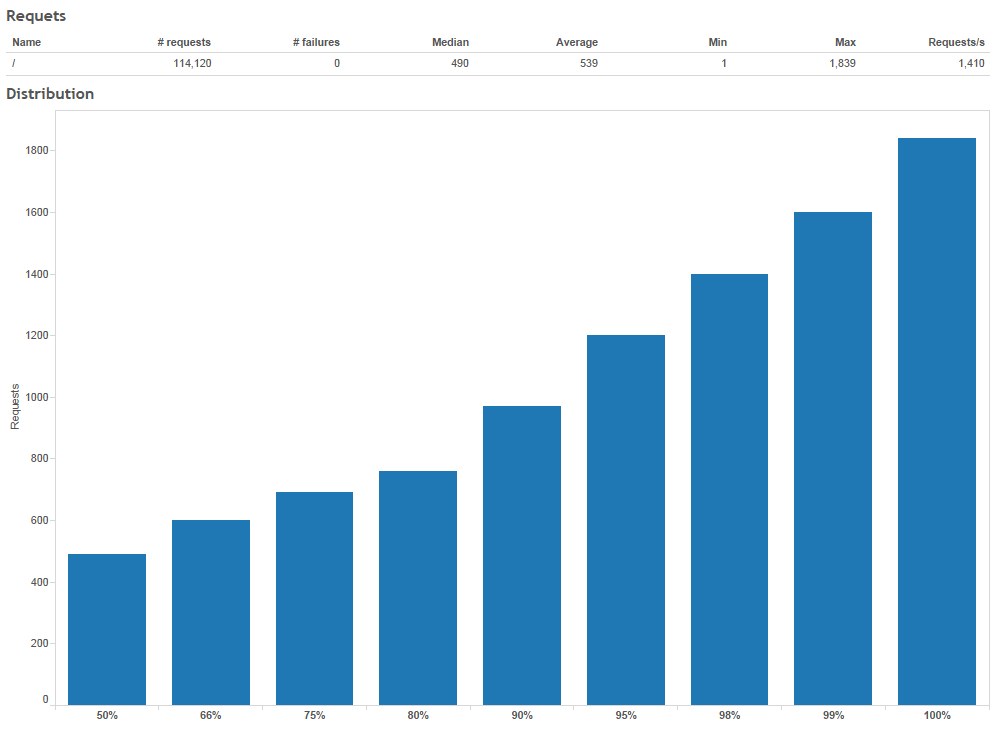
- the distribution of the response times (in distribution.csv)
After running Locust with 10,000 users for the first time, I had an error rate of over 40%… Tweaking the server a bit and running again, and I could now run with 10,000 users without errors, so that’s the first result! I then kept increasing the amount of users so I could find out how much load the system could take.
I then used Tableau to quickly chart the response time distributions. Obviously you could use any tool you like for this (Excel, D3.js, matplotlib, etc), but we have Tableau at work and it’s quick and easy.
And that’s about all I could think of doing with this data. If I was testing against multiple endpoints, I might have also have put the performance of each endpoint in a chart and compare them against each other.
But the main question I was trying to answer with this testing was “How many concurrent users can this system handle?”, and by using Locust I quickly got the answer.
Locust Distributed
Locust can also run in a distributed mode, where you have a master collecting the results and a number of slaves making the requests. You will know when you need to use this as the spawn rate will slow down to a crawl when you reach a certain number (about 8,000 for me). The documentation shows how to set this up. The only difference when running is the interface shows how many slaves are currently connected.
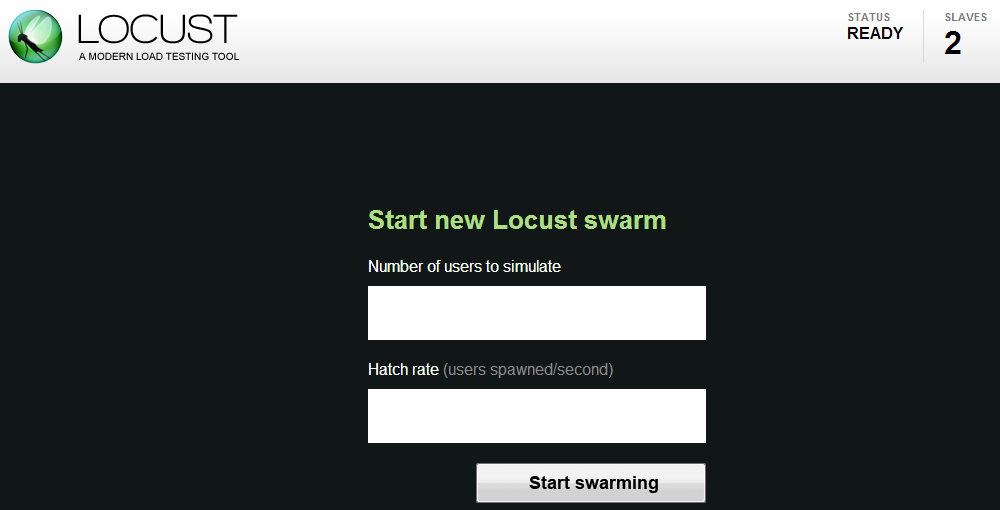
I just started up a couple of slaves on the same machine, as I had plenty of spare cores.
That’s all there is to it. Locust turned out to be perfect for my needs. If you are looking for a load testing tool I would recommend you give it a try.
Cover image by Niv Singer, on Flickr.